2024 3rd Quarter Market Commentary

The major U.S. stock market indexes have experienced powerful positive momentum for the past two years. Rising prices over an extended period of time invariably breed the expectation of continued rising prices, and that has certainly occurred this year among equity investors. The unprecedented level of money creation over the past decade and a half, as well as the repetitive rescues of both stock and bond markets since the Financial Crisis by the Federal Reserve and the U.S. Treasury whenever serious losses appeared possible, have emboldened investors to believe equity markets to be far less risky than longer history would suggest. Investors, conditioned over many years, have demonstrated a willingness to look past intermittent market pullbacks in the belief that long-term positive momentum would continue, and it has. So strong is that momentum and investor sentiment, it is likely that a significant negative event may be necessary to provoke a major change of market direction.
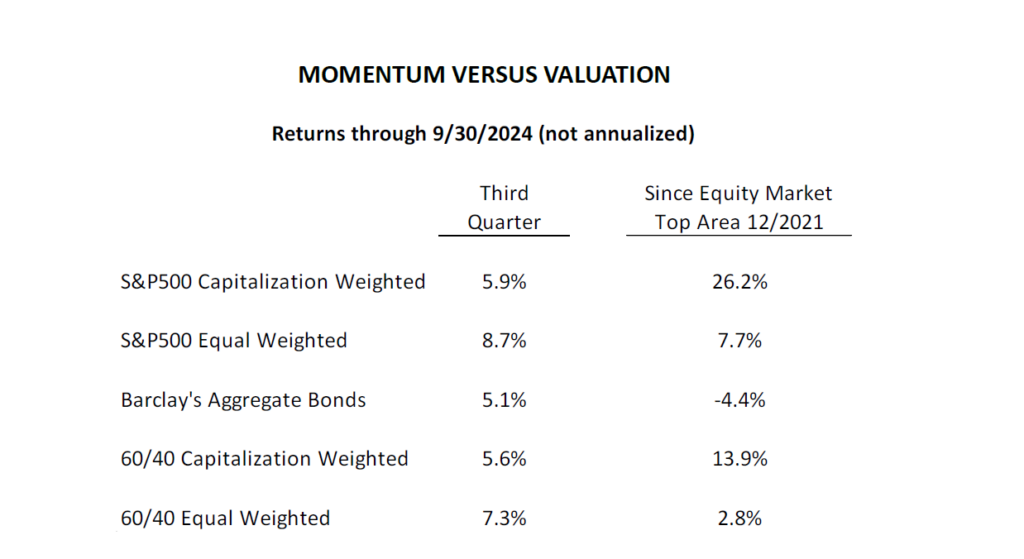
Reinforcing momentum and investor sentiment daily, talking heads on financial television praise the economy’s resilience plus Wall Street forecasts for double digit corporate earnings growth for the remainder of this year and through 2025. As I have returns through 9/30/2024 (not annualized) pointed out in prior Quarterlies, however, the “resilient” economy has avoided recession so far, but has been growing at a slower rate than the country’s long-term average. And that slower than average GDP growth is almost unanimously forecasted for the next few years, both domestically and globally. Such weak economic forecasts call into question Wall Street’s double digit corporate earnings expectations. Earnings growth rarely diverges that dramatically from the rate of economic growth.
While the markets are celebrating the beginning of Federal Reserve interest rate easing, there is an inordinate reliance on government intervention. Economic growth has remained below the long-term average, despite the government running deficits of 6% of GDP, a number never seen before the Global Financial Crisis. Historically, 3% to 4% deficits to GDP were strategies employed only to fight recessions. Now we also see the Chinese government breaking out a variety of economic and market stimuli to prop up a stagnating economy and weak equity markets. Has the world devolved to a point where government intervention is necessary to keep the world’s major economies humming?
So far, neither recognized nor under the surface economic or market weaknesses have significantly impacted equity indexes in the U.S. and many other countries worldwide. Now investors must wrestle with the question of whether the gravitational pull of reversion to valuation means will eradicate the gains of the past two or many more years.
As I have explained in some detail in recent Quarterly Commentaries, current levels of valuation are above all others in U.S. history but for those at the peak of the dot.com mania. And Warren Buffett’s favorite valuation measure – market capitalization relative to GDP – is higher even than that.
There is no way to know with certainty that past will be prologue. However, as I described in the January 2024 Quarterly Commentary, all eight major U.S. market peaks with extremely high levels of overvaluation since the 1930s were followed by an average decline of 40% that took prices back to levels on average first reached nine years earlier. Each of those market price peaks was then not permanently exceeded for 9.8 years on average.
Because today’s long-term momentum remains strong, equity prices may well continue to rise. Unless the 8 for 8 precedent of the past 90 years is inapplicable in this cycle, however, investors will have to exercise timely sales to avoid an average near decade-long wait to get back to peak value. Market history points to far more investors selling near market lows than market highs. Hope springs eternal when markets are strong, and sales often wait until a point of maximum pain tolerance is reached. While this time could possibly overcome historic precedent, I have always respected the view of the legendary Sir John Templeton who highlighted what he called the four most expensive words in the English language: “This time it’s different.” Another more recent legend, Jeremy Grantham, said: “Remember that history always repeats itself. Every great bubble in history has broken. There are no exceptions. I believe the only things that really matter in investing are the bubbles and the busts.” Perhaps the best known legend, Warren Buffett, known for having equity-dominated portfolios for many decades, now holds more cash equivalents than ever before, both absolutely and as a percentage of his portfolio. About a month or so ago, it was reported by CNBC that Buffett held more Treasury bills than the Federal Reserve. He has recently said that he can find nothing that represents attractive value, and he has been a fairly aggressive seller of some long-held equity positions.
In my own career, dating from the late-1960s, I have successfully navigated three traumatic market collapses – 1973-74, 1987 and the double bear markets covering 2000 to 2009 – by respecting historic market and individual equity valuation ranges. We have underperformed in many years since the Great Financial Crisis because of my disbelief that the Fed would dare to multiply its balance sheet to a degree that no country in history had ever successfully undertaken without ultimately experiencing serious debt problems and lengthy negative economic consequences. The final chapter in that story may not yet have been written. All of Mission’s portfolio management styles, including short-term cash management, have outperformed all fixed income styles and the performance of the average U.S. common stock (as measured by the Equal Weighted S&P500 index) since the market top area near year-end 2021.
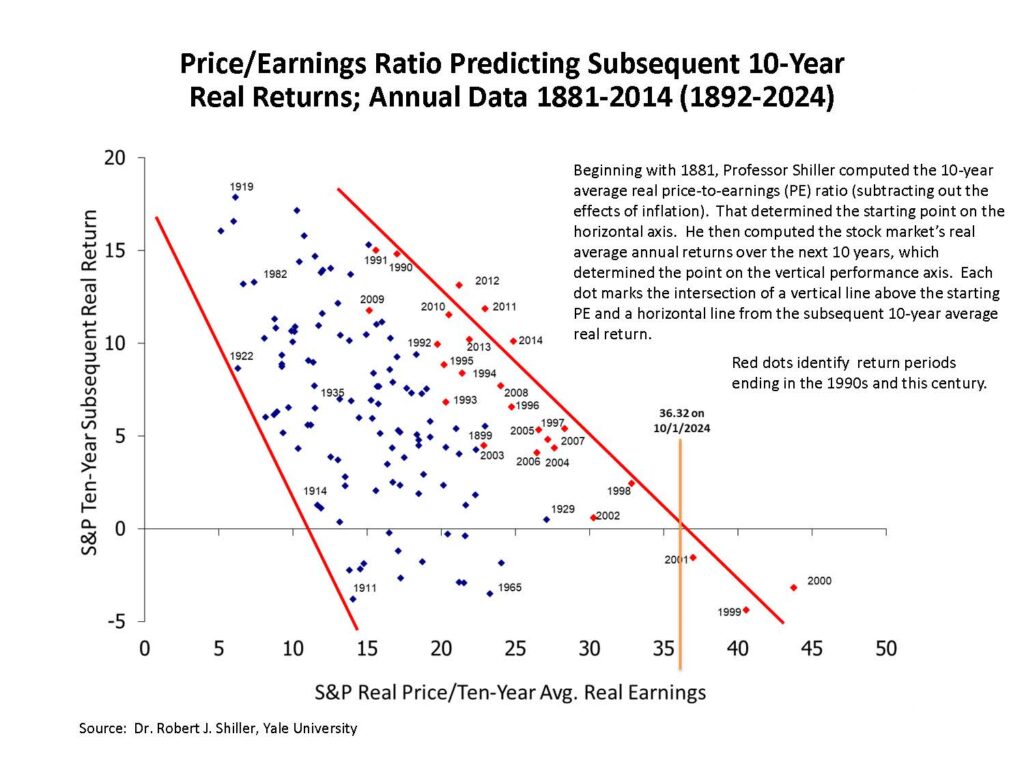
The graph below shows Nobel Prize winner Robert Shiller’s study of subsequent stock market returns from various price/earnings ratio levels covering a history of more than 130 years. The current 10-year average real price/earnings ratio of 36.32, marked by the vertical gold line, was exceeded by only three higher P/Es, all of which saw negative subsequent 10-year real returns (the dots below the zero level).
The resolution of the conflict between momentum and valuation will likely have a major effect on the financial wellbeing of American investors. I welcome your call if I can explain further any of the subjects addressed herein. I also look forward to seeing you at our November 7 conference.
Thomas J. Feeney
Chief Investment Officer

Mission’s market and investment commentaries reflect the analysis, interpretation, and economic views and opinions of our investment team. They are not intended to provide investment advice for any individual situation. Please contact us if we can provide insight and advice for your specific needs.

