

2024 4th Quarter Market Commentary
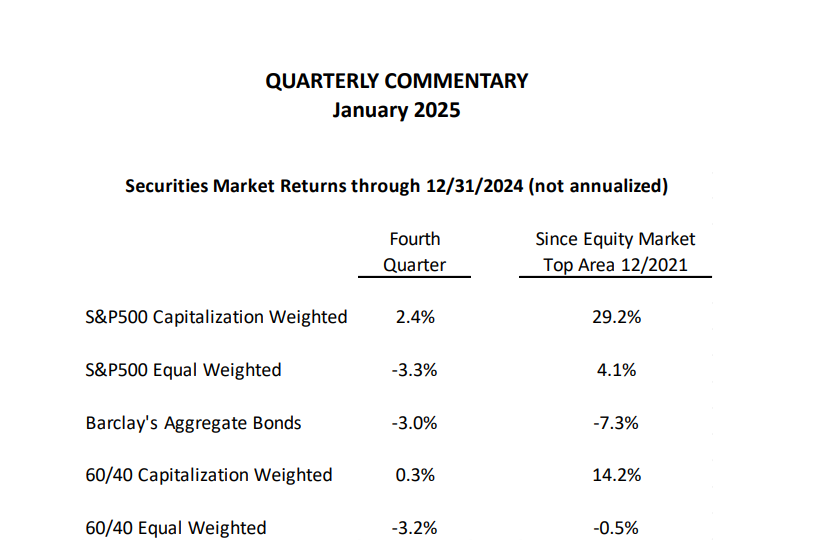
The fourth quarter looked like the last three years in miniature. The S&P 500 had a positive return, but most of its component stocks did not do well. A small number of stocks, especially the Magnificent 7, performed remarkably well, but a large number lost money. The total return of the capitalization weighted index itself was 2.4% in the just completed quarter, roughly in line with the three-year growth of 29.2%, a compounded 8.9% per year. However, the equal weighted S&P 500, a good representation of the average stock, lost 3.3% in the fourth quarter and grew by only 4.1% over three years, a compounded 1.3% per year.
Fixed income investments, except for very short maturities, were even worse both for the fourth quarter and since the end of 2021. Even including the interest income, the Barclay’s Aggregate Bond Index lost 3% in the quarter and 7.3% over the full three years, one of the worst three-year periods in U.S. history.
Using the Magnificent Seven-dominated capitalization weighted S&P 500, the widely recommended 60/40 stock/bond allocation produced a substandard 4.5% annualized three-year return. The more representative 60/40 allocation using the equal weighted S&P 500 actually showed a three-year loss.
So much for what has brought us to where we are today. What’s most important is where we’re going. Because no one knows what the markets will do, our job is to determine what is most likely and to weigh potential rewards against potential risks.
In a recent Quarterly Commentary, I highlighted the famous Benjamin Graham quote: “In the short run, the market is a voting machine. In the long run, it’s a weighing machine.” In the short run, the market responds to how the investor feels, how he/she interprets current economic, monetary and market conditions. Bullish conditions and rising stock prices facilitate increased investor confidence. The longer a market advance progresses, the more investors vote with confidence for even higher prices. That’s how peaks of overvaluation are reached. As has happened throughout market history, however, when valuations and/or investor sentiment reach extremes, the weighing process has invariably brought prices back to or below long-term means. That weighing process depends most heavily on market valuations.
As I have written in all of our recent commentaries, by various measures the equity markets have been at or near their most overvalued levels in U.S. history. For readers interested in many of the specific studies that I review regularly for valuation data, I have provided current information about those most meaningful in my work in the appendix to this commentary. I have also included comments about a few studies that provide measures of investor sentiment that serve as confirmation of conclusions to be drawn from valuation studies. At current levels, these studies warn investors that markets present huge levels of risk.
Viewers of financial television don’t hear warnings of great risk. On the contrary, Wall Street analysts and strategists are almost invariably bullish. For example, the consensus of that group of experts has forecasted exactly none of the last seven U.S. recessions, covering approximately three-quarters of a century.
There is much commentary about the fact that the S&P 500 has provided 20+% returns for the past two years, largely on the strength of the Magnificent Seven. This followed a negative 18% S&P return in 2022, also heavily influenced by the Magnificent Seven, which as a group were roughly cut in half from peak to trough. TV commentators have downplayed expectations for another 20% year in 2025, but almost all anticipate at least moderate gains.
B of A Securities put out a recent study of the four prior times of consecutive 20+% gains in the past 100 years. Back-to-back high gains in 1927 and 1928 preceded the infamous Great Depression that began with a 13% decline in 1929 but ultimately eliminated 86% of the market’s value reached at the early 1929 market peak. The market rebound from the 1929 collapse began in mid-1932 and led to back-to-back 20+% gains in 1935 and 1936. These were unfortunately followed by a 39% loss in 1937.
The next double-20+%s came in 1954 and 1955 and were followed by a modest 3% gain in 1956. The only big gain after double-20+% occurred in 1997, a positive 31%, after the strong equity markets of 1995 and 1996. Those three years were part of the buildup to the dot.com peak in 2000, which preceded two 50+% bear markets that dominated the first decade of this century and brought the S&P 500 back to 1996 levels.
In three of the four double-20+% instances, the entire gains of the two outstanding up years were completely erased in subsequent years. Only the 1954-55 advance survived the market’s tendency to reverse abnormally strong advances. In fact, the 1927-28 and 1995-96 advances preceded the two price peaks with the highest levels of overvaluation up to those time periods in U.S. history. As detailed in the appendix, today’s level of overvaluation exceeds that of 1929 and, by many measures, the dot.com era’s valuation peak at the turn of the century.
Does that mean that equity prices are doomed at current levels? Certainly not, at least in the short to intermediate time frame. Voters can continue to overcome weighers, especially in the near-term.
Lowry Research, the oldest continuously published technical advisory service in the U.S., dating from the 1930s, has remained moderately bullish, despite six weeks of market weakness since early December. They make the point that the recent weakness has not erased the longer-term strength evident at the November-December highs. Acknowledging a deterioration in the state of intermediate-term stock participation, they still see the longer-term uptrend intact. They are now somewhat cautious and are waiting to see if the very recent mid-January rally is strong enough to improve several of their weaker short-term indicators.
Market price advances can persist on technical strength alone, but real sustainability typically requires fundamental strength as well. Equity market bulls continue to point to a “strong” economy and anticipated double-digit earnings growth. Most people would not characterize recent years’ below average GDP growth as “strong”, but something less positive would not fit the desired narrative. Long-term U.S. GDP growth has been 3.2%. The International Monetary Fund’s latest forecast for U.S. GDP growth is for 2.8% in 2024, 2.7% in 2025 and 2.1% in 2026. Last month the Congressional Budget Office estimated that the U.S. economy will have grown by 2.3% in 2024 and will grow by 1.9% in 2025 and by 1.8% in 2026. They further estimated an average 1.8% growth in the following years through 2035. Hardly “strong”!
Despite only modest economic growth estimates from virtually all forecasters, Wall Street firms continue to forecast mid-teens corporate earnings growth rates for the next few years. Such forecasts a year or more in advance are typically too high. FactSet’s estimates for still being finalized 2024 earnings growth are 8.8% for GAAP earnings and 9.3% for operating earnings. While such growth is nothing to sneeze at, these readings are well below last year’s mid-teens forecasts. The S&P’s over 20% 2024 advance could have been achieved with under 10% earnings growth only by price/earnings multiples jumping markedly. That kind of investor enthusiasm is the principal ingredient in the historic overvaluations we now experience.
As we head into 2025, there are a great many uncertainties, both economic and geopolitical. The single greatest hope is that artificial intelligence will develop rapidly and be productively and profitably applied in short order. Despite that hope being widely held in the investment community, it has not led to better than the tepid economic forecasts listed above.
There are considerable uncertainties regarding interest rates and the path of fixed income investments. Because markets are still reacting to the changes in monetary policy since the Fed-induced zero bound interest rate era, it is hard to anticipate accurately upcoming interest rate levels. Last year’s anticipation of four Fed interest rate cuts in 2025 has been reduced to one, with either two or none possible. In all likelihood, short treasury rates will remain in the 4%s through 2025. The path of longer rates is far more problematic. The most recent federal budget deficit estimate is $1.9 trillion, and is anticipated to grow to $2.7 trillion by 2035. As those amounts are added to the country’s already huge national debt, large amounts of new government debt securities will have to be brought to market. There is also an avalanche of corporate debt that has to be rolled over in the next few years. All else equal, that volume of debt issuance will tend to push interest rates higher, even if the Fed is able to bring short rates lower. Rising longer rates would penalize existing bond portfolios and would make corporate profitability tougher to realize.
I would like to extend portfolio maturities beyond the nearest few months, where the highest rates still are found. Longer rates have been rising since September, but we are still earning more at the short end of the yield curve. In fact, as some of our fixed income positions mature, we have found a better return in overnight government-guaranteed money markets than in any longer maturities. We evaluate the alternatives every day and take advantage of occasional brief upward bounces in yields to move some of the money market cash out a few months. If longer rates continue to rise, we will eventually find more attractive alternatives.
Geopolitical uncertainties are also significant. How will conflicts in the world’s military hotspots ultimately be resolved? Could anything new arise in Taiwan?
The new Trump administration has threatened the imposition of tariffs on allies and adversaries alike. At this point no one knows whether or when such tariffs will materialize, how broadly they might be applied or how expensive they could be. Small and strategic tariffs don’t tend to arouse much animosity or response from other countries. On the other hand, this country can look back through its own history to see the potentially destructive effects that can come from an imposition of tariffs. To protect its own producers, the United States passed the Smoot-Hawley Tariff Act in 1930. Dozens of countries soon retaliated by increasing their own tariffs. International trade declined by 66% from 1929 to 1934, a factor that exacerbated the Great Depression. In a world currently burdened by unprecedented debt levels, almost no country could escape unscathed from a significant decline in worldwide trade in the next few years.
As I have written repeatedly in these commentaries, powerful momentum in the equity markets over the past two years can continue so long as investor optimism continues. History demonstrates, however, that such optimism has never in the past continued for long after equity valuations have reached levels well below today’s. Will the development of artificial intelligence negate that history? I believe it will not. AI is unlikely to be more transformational than the invention of the computer or the development of the internet, without which AI would not be possible.
Current valuation and sentiment measures that follow in the appendix may help investors evaluate the investment time frame in which to focus their equity exposure, as well as the potential for risks relative to rewards in their asset allocation decisions.
Appendix
Valuation
A large number of valuation measures provide the primary foundation blocks for establishing where on the risk-reward continuum I prefer to locate equity allocations.
- The single most informative is a Ned Davis Research study of valuation measures at the major stock market peaks and troughs over the past 100 years. I described key points of this study in our January 2024 Quarterly Commentary. Prior to the year-end 2024 reading, the summaries of the price/earnings, price/dividends and price/book values of the S&P 500 at the eight prior major market peaks identified levels at which significant equity allocations led to destructive losses. On the flip side, the seven prior major market lows demonstrated valuation levels that led in each instance to huge multi-year equity gains. Year-end 2024 measures show overvaluation far above the average of the eight prior market peaks and above seven of the eight individual peaks, only trailing slightly the dot.com peak in 2000. The average S&P 500 price decline from peak to trough following the prior eight peaks was 40%. Those declines erased an average of nine years of prior gains. It also took an average of 9.8 years for prices to climb permanently above each of the earlier market peaks.
- Warren Buffett’s favorite measure of valuation is the stock market’s capitalization (the value of all stocks) relative to the size of the economy. Multiple studies show the year-end ratio at the highest level of overvaluation ever. Earlier peaks in 1929, 1936, 1968, 1973, 2000, 2007 and 2021 all led to significant equity market declines. The declines from 1929, 1968, 1973, 2000 and 2007 were the most severe in U.S. history. A Ned Davis Research study of the ratios of market capitalization relative to Gross Domestic Income since 1925 showed S&P 500 performance progress from points above the linear regression trendline staying below the starting price level for as long as 11 years. Conversely, starting from points below the trendline, the S&P index increased by an average of 242% over 11 years. At year-end 2024, the ratio was far above the trendline.
- In our October 2024 Quarterly Commentary, I described a study of data since 1892 by Nobel Prize Winner Robert Shiller. It measured the subsequent annualized 10-year S&P 500 real total returns from starting points of 10-year average real price/earnings ratios. Using over 130 years of data, Professor Shiller says that current data point to an annualized real 10-year average return of 0.2%. Anecdotally, although unrelated to the Shiller analysis, Goldman Sachs recently forecasted an average annualized 10-year return of just 3%, not as bearish as the Shiller forecast, but hardly bullish. This would be less than the historically normal risk-free U.S. Treasury bill return.
- Most analysts and commentators recognize that the major stock market averages are trading at historically extreme valuations. A great many argue, however, that those valuations are heavily influenced by a small number of primarily high-tech companies selling at very high multiples. They contend that most companies trade at far more reasonable, even undervalued levels. Another important study prepared by S&P Capital IQ Compustat shows that the median price/earnings ratio for components of the S&P 500 was 26 at year-end. That valuation is neither undervalued nor even moderate. It is 46% above the median reading of 17.8 over the 60 years of that survey. That PE ratio has been higher in only two prior time periods – the dot.com era preceding the worst market decline since the 1930s and early 2020 which led to a 35% one month decline in the S&P 500.
The equity selection process that I developed for my company in 1985, which we still use today, examines the valuation history of all stocks in our eligible universe. It analyzes how each stock’s PE ratio compared to the S&P 500’s ratio every year back more than 50 years, if the company has that much history. A great many companies always trade at lower valuations than the S&P 500. That, by itself, doesn’t mean the company is undervalued. Interestingly, almost every company that currently falls in our undervalued category has forecasts for declining year over year earnings in one or both of the next two quarters. Confirming our inability to identify currently attractive undervalued candidates, the most widely acclaimed value investor of the modern era, Warren Buffett, recently proclaimed that he could find nothing representing good value. That explains why Buffett currently holds the greatest amount of risk-free treasury bills in his career, on both an absolute basis and relative to the size of his company’s portfolio.
While not a study that I use regularly, the following is worth consideration by anyone who appreciates valuation levels. In its January 7 publication, Hussman Strategic Advisors wrote: “The technology sector itself is trading at the highest multiple to revenues on record. Meanwhile, the growth rate of overall S&P 500 revenues, which include the technology sector, is below historical norms while the S&P 500 price/revenue multiple is three times its historical norm, easily eclipsing the 1929 and 2000 peaks.”
There are many dozens of additional valuation studies that I review on a daily, weekly, monthly or quarterly basis. Combined, they all serve to fill out the full picture of equity valuation at any point in time. But the four I’ve profiled above and our own traditional process carry the most weight.
Sentiment
The commitment to equities from both retail to institutional investors is near all-time highs. As a contrary indicator, such historically high levels of optimism more often than not precede stock market weakness.
Unlike with valuations, where I have a few primary measures that are most important in indicating appropriate levels of equity portfolio weight, there are many dozens of studies that together provide a picture of the level of investor enthusiasm for equities. Some studies are done by polling, but I prefer those that indicate what investors are doing rather than saying. Here are some examples.
The most recent study of domestic and global equity mutual fund and ETF assets less their cash holdings shows recent equity levels above the peaks preceding the serious 2000 and 2007 bear markets. At the same time, current cash holdings are well below those in 2000 and 2007.
Federal Reserve statistics show that stocks as a percentage of household financial assets reached an all-time high in the third quarter. Prior peaks served as warnings of each of the major stock market declines of the past 73 years. At the other extreme, the low water mark in that nearly three-quarters of a century period came in 1982 and accurately identified the beginning of a multi-decade bull market run.
A recent report on the Rydex Total Leverage Bull/Bear Ratio showed 103 times more assets in leveraged long funds than leveraged short funds, a new all-time record. That ratio is another caution flag waving, as leverage and speculation tend to expand to extremes approaching stock market peaks.
December’s Bank of America Global Fund Manager survey showed that 36% of fund managers were overweight U.S. equities, the highest level in the 30 year history of the survey. As for the little guys, the CBOE Small Traders net long futures positions reached a new record in mid-December. Just can’t get enough stock exposure!
Concentration
Concentration of assets into a small number of stocks is not a normal part of my analysis of appropriate levels of equity weighting in portfolios. Current conditions, however, make it potentially a very important consideration.
William Hester of Hussman Strategic Advisors presented an outstanding, detailed analysis this month of the effects of very heavy concentration of assets in a small number of stocks. Introducing his article, he said: “By some measures, stock market capitalization has never been more concentrated among a handful of large stocks as today. The closest parallel to this level of concentration in modern market data is the late-1990’s technology bubble, reaching its peak in 2000….Over the past five and half decades, there have been two previous peaks in market concentration: one in 1973 and another in 2000. Today, market concentration has reached an all-time high and…is higher than levels seen in the early 1930’s.” Not coincidentally, 1973 and 2000 marked the beginnings of the biggest bear markets since the Great Depression. With considerable supporting detail, Hester makes the point that “following periods of high market concentration, stock market returns are not only low over the subsequent decade, on average, they also tend to be highly volatile” with deeper drawdowns.
Summation
More than a half century in the investment management business has taught me to honor the wisdom gleaned from often repeated past experience. An excellent brief summary of that point comes from A Short History of Financial Euphoria by John Kenneth Galbraith. “There can be few fields of human endeavor in which history counts for so little as in the world of finance. Past experience, to the extent that it is part of memory at all, is dismissed as the primitive refuge of those who do not have the insight to appreciate the incredible wonders of the present. Only after the speculative collapse does the truth emerge.”
Thomas J. Feeney
Chief Investment Officer
Mission’s market and investment commentaries reflect the analysis, interpretation, and economic views and opinions of our investment team. They are not intended to provide investment advice for any individual situation. Please contact us if we can provide insight and advice for your specific needs.
