

2023 4th Quarter Market Commentary
Fundamentals vs. Technicals
Over the past century, U.S. securities market technical conditions have been in agreement with fundamental conditions most of the time. As we enter 2024, fundamentals and technicals are clearly at odds with one another, creating highly uncertain prospects for investors (for readers unfamiliar with those terms, see Appendix A for explanations).
Financial media are replete with news about the powerful equity rally over 2023’s last nine weeks. The rally rescued a minimally positive year through late October for all but the Magnificent Seven that dominated the headlines for most of the year. That recent momentum heads the list of bullish technical factors as we move into the new year. I will evaluate that and other technical and fundamental factors that point to diametrically opposing potential market outcomes. First, let me review what has brought the equity and fixed-income markets to their current positions.
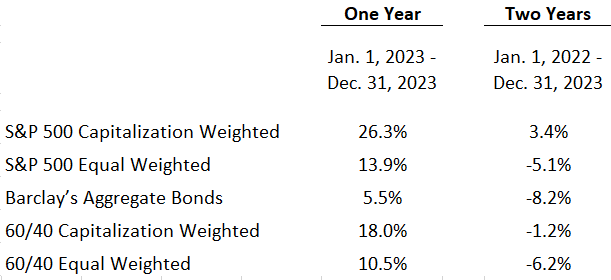
Notwithstanding powerful November and December performances by both equity and fixed-income securities, the vast majority of common stocks and virtually all but the shortest maturity bonds underperformed the 6.4% risk-free U.S. Treasury bill return over the past two years, as seen in the following table.
We are pleased to report that, after our having taken a very conservative approach, all Mission portfolios over which we have asset allocation responsibility have outperformed the major equity and fixed income indexes over that two-year period.
As we face the question of where we go from here, multiple indicators are pointing to higher equity prices with very high historical rates of success. At the same time, multiple indicators are pointing to recession and lower equity prices with similarly high success rates. The former group is largely technical; the latter, fundamental.
Technical Indicators
One of the bullish technical indicators is the expanding number of stocks rising over the past two months. While nearly all equity strength in last year’s first ten months was attributable to the Magnificent Seven, a much broader list of stocks established uptrends in the year’s last two months. While increased breadth by itself is not a guarantee of further gains, very few sustainable rallies last long with narrow leadership. And although there have been pullbacks in the broad-based advance/decline lines in the first two weeks of the new year, these appear more in line with the recent price pause than with the beginning of negative breadth divergences that typically become evident before major market tops.
Sellers were in control of U.S. markets going into late October, but that changed dramatically in November and December. It turned out that technical factors that normally produce negative market reactions were largely negated by the November-December positives. Next year gains have a very strong probability when the market experiences the equity breadth increase seen in December. The number of stocks in longer-term uptrends has expanded sharply. Historically, current conditions typically identify healthy internal market momentum.
One potential conflict with relatively significant breadth strength, however, is that the New York Stock Exchange Composite relative strength line has failed to reflect the gains in other markets. It has been in a rangebound consolidation since May still with a downward bias.
While the first half of election years tends to be choppy with lows on average in May, the best returns in election years occur more often when the incumbent is running, as is the case in 2024. One has reason to wonder, however, whether election year strength will materialize this year with the leading candidates of the two major parties suffering strong disapproval ratings.
Technical conditions are never all in one direction. Investor sentiment at extremes is a contrary indicator. A great many sentiment indicators are today at optimistic extremes. Short-term conditions are clearly overbought. The VIX index is below 13, a very high level of complacency. The CNN Fear-Greed index is in “Extreme Greed” territory. In December, the S&P500 Relative Strength Index went to its most overbought level in three years. Whenever investor sentiment becomes heavily one-sided, it’s worth remembering legendary market analyst Bob Farrell’s Market Rule #5: “The public buys the most at the top and the least at the bottom.”
While the significant negative market conditions experienced through last October did not yet lead to even more substantial market losses, a great deal of internal market damage was done. We can’t know if that has been adequately repaired, but the nearly century-old, award-winning technical advisory firm, Lowry Research Corporation, stated last week that, while some strong momentum measures are at or near overbought, “…longer-term conditions remain favorable for an eventual resumption of the market’s advance.” Technical conditions are net positive.
Fundamental Factors
Notwithstanding the usual chorus of perennially bullish analysts and strategists on financial TV, underlying fundamental factors are predominantly bearish. Recessions invariably lead to equity market declines, typically falling 20% or more before and during recessions, and several factors indicate a strong likelihood of a coming recession. The depth of market declines is most often dictated by the degree of overvaluation that precedes the decline. I will assess current valuation levels after addressing a few other points.
While there has been no economy-wide recession identified yet, there has been what many declared an earnings recession as corporate earnings declined year over year in 2023’s first two quarters. An even more meaningful indicator, the Institute for Supply Management’s Purchasing Manager’s Index has been declining for 14 consecutive months. Only eight prior times has this monthly index declined for 13 or more consecutive months. In each case, the economy was heading in, already in, or coming out of a recession.
Rosenberg Research recently revealed that the Conference Board’s Leading Economic Index has suffered 20 consecutive monthly declines, a similar string as in 2007-08 and 1973-75, both periods of destructive stock market declines. The Conference Board’s LEI recession signal has preceded each of this century’s three recessions with no false signals, and it has indicated a coming recession in 2024.
Rosenberg Research CEO David Rosenberg has frequently commented about the U.S. Treasury yield curve, which has now been inverted for 18 months. He has indicated that every Federal Reserve-induced yield curve inversion, regardless of length, has resulted in a recession. Elliott Wave International recently added: “Most financial turmoil occurs after the yield curve un-inverts.” It has gotten closer in the past month.
The latest Fed Beige Book contributes to the prospect of a weakening economy. Two-thirds of the country’s districts reported either neutral or contracting economic growth, with none accelerating. Bloomberg recently reported that its consensus U.S. GDP growth forecast for 2024 was just 1.3%. The Organization for Economic Co-operation and Development is forecasting just 1.5% U.S. GDP growth in 2024 and a barely better 1.7% in 2025. The OECD sees the global economy facing the challenges of inflation and slow growth prospects. It anticipates that tighter financial conditions will work against economies along with weak trade growth and lower business and consumer confidence. It expects global growth to weaken to 2.7% in 2024 from 2.9% in 2023. That growth would be highly dependent on fast-growing Asian economies, but a rapidly weakening China could pose risks to even that meager forecast. The International Monetary Fund projected global growth to slow for the third year in a row to just 2.4%. This month the World Bank’s Global Economic Prospects report is forecasting the global economy to experience its slowest half decade in 30 years. The European Central Bank dropped growth forecasts from 1.0% to 0.8% with risks skewed to the downside. It would take minimal disruptions to turn these numbers into recession range.
The securities markets are anticipating a continuing decline in interest rates across the yield curve led by multiple 2024 reductions in the Fed Funds rate. Should that occur, it’s not necessarily a panacea for all that ails the economy. The Fed dropped short-term rates aggressively through the two most destructive economic and stock market declines in this century, 2000-03 and 2007-09. These periods suffered recessions and 50% and 57% bear markets respectively. Furthermore, it is unclear whether the Fed will be able to provide the rate relief the markets are anticipating.
Because of growing deficits and debts, there will be an unprecedented flood of new bond issuance in the years ahead, which may well keep interest rates higher than currently anticipated. The U.S. is expected to issue $1.6 trillion in new debt in 2024’s first half. Rosenberg Research reported this month that the corporate sector has to roll over more than $8 trillion of short-term debt in the next year. This will occur at much heavier interest costs unless rates decline dramatically. Higher rates would put pressure on corporate earnings. Add to this a huge $1.9 trillion in high-yield debt coming up for refinancing over the next five years. If rates stay high, this might be difficult debt to roll over. In December, the Financial Times reported that U.S. corporate bankruptcies had already soared over 30% in the last 12 months.
Let me turn now to what I consider the single most important determinant of future stock market returns – the price you pay relative to the underlying valuations of the stocks you buy or own. TV’s talking heads tend to blow off today’s valuations with something like: “They’re not cheap but….” before introducing some current factor they expect to improve. Today’s stocks are not only “not cheap”, they are near the most expensive levels in U.S. history. Let me examine that contention in the two following ways.
At the close of the market on January 12, the S&P500 was selling at 25.3 times earnings on a Generally Accepted Accounting Principles (GAAP) basis. There are only five instances in U.S. history when the market traded above 25 times earnings on a GAAP basis. In each instance, the market’s price/earnings ratio dropped sharply over the next few years. The only time the market was able to maintain a ratio above 25 for a sustained period was from 1998 to 2003. That period included two powerful market declines which accompanied strong earnings declines. That lengthy period ultimately saw equity prices fall below those of the years of 25+ multiples, as the market in 2009 was back to the level of 1996. This 25+ multiple has been a historically dangerous level of overvaluation.
The most sobering factor about overvaluation is demonstrated in the following graph and explained in some detail in Appendix B.
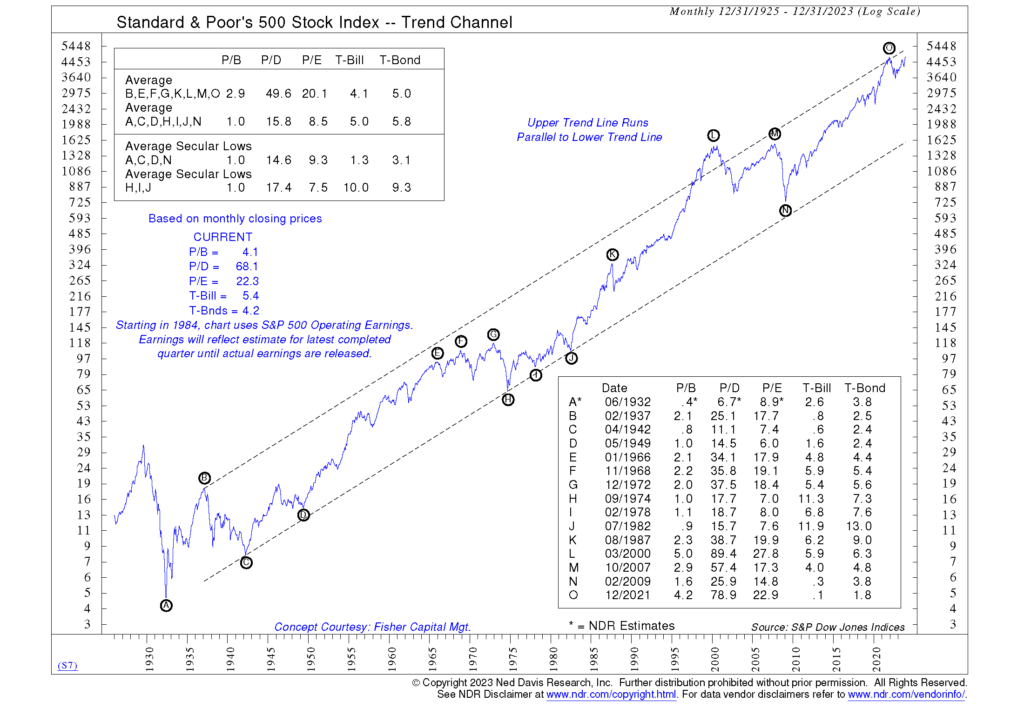 This “history on a page” graph from the highly informative Ned Davis Research firm traces the progress of the S&P500 on a log scale from 1925 to the present. The lettered annotations mark this country’s major stock market peaks and troughs after the Crash of 1929. It is noteworthy that nearly a century of data conforms quite neatly to the outlined trend channel. The price/book value, price/dividends, price/earnings, Treasury bill, and Treasury bond levels are listed for each lettered market peak and trough in the table in the lower right corner of the graph. The average for each individual measure of the lettered market peaks is shown across the top line in the table in the upper left corner of the graph. Similarly, the average for the lettered market troughs is displayed on the next lower line in the same table. Directly below the box in the upper left corner, you can see the 2023 year-end values for each of the individual measures. What is immediately striking is that the current equity valuation measures (P/B, P/D, P/E) are all more overvalued than the average valuations at this country’s major market highs for the past 90+ years. Only two of the eight lettered peaks (L in 2000 and O in 2021) showed higher valuations than at 2023’s year-end. Those two peaks were immediately followed by sharp equity market declines.
Appendix B describes the aftermath of each peak – how far the Dow descended in what period of time, how many years of prior gains were wiped out, and how long it took to get back to the prior peak and permanently exceed it. The average decline from the listed peaks to the ultimate troughs was 40.0%. The declines took prices back to a level first reached 9.0 years earlier (ranging from 1 to 15 years). The lettered high levels were not later permanently exceeded for 9.8 years on average (ranging from 4 to 16 years). The longest such expanse of time before permanently exceeding a former high in this country was 25 years from 1929 to 1954. The longest in any industrialized country is in Japan, which today is still more than 10% below its 1989 peak more than 34 years later.
Where Do We Go From Here
The equity market advance through November and December has markedly improved the technical picture, which increases the prospects for a continuation of the rally into 2024. The strongly bullish sentiment, which at extremes is a contrary indicator, is heavily dependent, however, on considerable Federal Reserve interest rate relief. The Fed itself has not committed to the amount of rate relief that the market has already priced in. Should the anticipated amount of rate reduction not materialize, the level of disappointment could be meaningful.
The fundamental picture is not nearly as positive as the technical. No independent economic forecasting organization is looking for anything more than low single-digit GDP growth for the next few years either domestically or globally. At the same time, U.S. securities analysts are forecasting double-digit corporate earnings growth. While not impossible, such earnings growth is highly unlikely unless economic growth is quite a bit stronger than currently forecast. If a recession materializes in the next year or two, earnings and equity prices would likely decline.
The greatest potential risk to investors is the message that flows from the above graph and the details in Appendix B. If the markets respond in the years ahead in the same manner as they have from even less extreme levels of valuation throughout the past century, equity prices could retreat significantly, and recovery time could be lengthy.
Compounding the dilemma for investors are uncertainties. Some uncertainties are always a part of the investment environment. In the year ahead, however, we are faced with at least two that could be particularly influential: 1) The U.S. presidential election, especially the primaries, the prosecutions of former President Donald Trump, possible convictions and potential responses of his supporters; and 2) Potential expansion of military conflicts in Ukraine, Gaza, the Red Sea and possible new venues like Iran and/or China-Taiwan. Any of these could precipitate major and highly unpredictable market effects.
As we have regularly explained to clients, markets can always defy even unbroken records of past precedent. Technical strength can carry prices to unprecedented levels of valuation, although they have never before stayed far above average. U.S. stock markets have always ultimately reverted to their fundamental means. In making our investment decisions, we rely most heavily on fundamental considerations, with a concentration on attractive valuations.
We welcome the opportunity to review with all clients their portfolio allocation and risk profile preferences in light of current conditions.
By Thomas J. Feeney, Chief Investment Officer
Appendix A
Technical analysis involves the study of historical market data, including price and volume, on individual securities, sectors, and broad market indexes. Using insights from market psychology, behavioral economics, and quantitative analysis, practitioners use past performance and behavior to forecast potential future market behavior. Analysts look at chart patterns and statistical indicators.
Fundamental analysis involves examining individual companies, multiple companies, and even whole economies to determine their financial conditions, using such data as balance sheets, income statements, and cash flow statements. Various measures of profitability and valuation are employed, such as earnings per share, price-to-earnings, price-to-dividends, price-to-book value, price-to-sales, and price-to-cash flow ratios, along with debt levels and returns on equity.
Appendix B
B. The Dow declined 49.1% initially from 3/10/37 to 3/31/38, then ultimately 52.2% to 4/28/42. The 1942 trough took prices back to a level first reached in 1927 (15 years). The 1937 peak was not reached again until 1945 (8 years) and was not permanently exceeded until 1949 (12 years).
E. and F. The Dow declined 25.2% initially from 2/9/66 to 10/7/66. It never regained the former high before declining 35.9% from 12/3/68 to 5/26/70. The 1970 trough took prices back to a level first reached in 1959 (11 years). The 1966 peak was not permanently exceeded until 1982 (16 years).
G. The Dow declined 45.1% from 1/11/73 to 12/6/74. The trough took prices back to a level first reached in 1958 (16 years). The early 1973 peak was not permanently exceeded until late 1982 (10 years).
K. The Dow declined 36.1% from 8/25/87 to 10/19/87. The trough took prices back to a level first reached in 1986 (1 year). The 1987 peak was not permanently exceeded until 1991 (4 years).
L. The Dow declined 37.8% from 1/14/00 to 10/9/02. The trough took prices back to a level first reached in 1997 (5 years). The 2000 peak was not permanently exceeded until 2011 (11 years).
M. The Dow declined 51.1% from 10/9/07 to 3/5/09. The trough took prices back to a level first reached in 1996 (13 years). The 2007 peak was not permanently exceeded until 2013 (6 years).
O. The Dow declined 21.9% from 1/3/22 to 9/30/22. The trough took prices back to a level first reached in 2019 (3 years). The peak was barely exceeded last month (almost 2 years). There is no way to know whether it has been permanently exceeded.
Mission’s market and investment commentaries reflect the analysis, interpretation, and economic views and opinions of our investment team. They are not intended to provide investment advice for any individual situation. Please contact us if we can provide insight and advice for your specific needs.
