2024 1st Quarter Market Commentary
The Asterisk Era
Sports fans with at least a little grey hair remember well the steroid era in baseball, ranging from the late-1900s into the early-2000s. Performance-enhancing steroids were outlawed but commonly used, and sluggers like Mark McGuire, Sammy Sosa and Barry Bonds were shattering decades-old home run records. Fans with respect for cleanly earned records lobbied for putting an asterisk after records set in the era when many players used more than caffeine as a stimulant.
I suspect that when the history of the last decade and a half is written, investors with respect for cleanly established performance records will clamor for asterisks to be appended to investment extremes recorded since the Financial Crisis. Since at least 2008, the Federal Reserve and U.S. Treasury have flooded the economy with unprecedented monetary steroids. All money in an economy has to go somewhere, and a disproportionate amount found its way into stocks and bonds for well more than a decade.
Although the government has attempted to turn off the monetary spigot over the last couple of years, residual pandemic funds, investor confidence and enthusiasm remain. Since the Financial Crisis, the Fed and other world central banks have established a pattern of coming to the rescue whenever the potential for meaningful stock or bond losses loomed. Many investors still expect–at least subconsciously–some governmental action to prevent any severe or lengthy portfolio erosion. Such is the legacy of years of government intervention whenever serious losses threatened.
After the asterisk era in baseball, light-hitting second basemen stopped hitting 20 or more homers in a season. Once the full effects of higher interest rates and quantitative tightening are felt, stocks may be expected to return to historically normal levels of valuation.
I began my investment career in the late 1960s and experienced a somewhat similar environment during my first several years. Through the 1950s and most of the 1960s, stocks rose aggressively with only a few relatively modest corrections. By the late 1960s, in order to promote new business, mutual funds (no ETFs at that time) had to be able to forecast at least mid-teens investment performance. So strong were the confidence and expectations built up over the prior two decades that even a 36% market decline in 1969 and 1970 failed to dent the belief that heavy equity allocations were necessary for meaningful portfolio growth. It took the 45% stock market decline in 1973-74 that brought prices back to the 1958 level to eliminate that generation’s unwavering dedication to equities. It took until 1982 for the market to regain its 1973
high. Several more years passed before investors became comfortable again with heavy equity allocations.
The current situation seems similar because the confidence strongly built by a decade and a half of government support for markets has enabled investors to shrug off sharp but short market declines in 2018 and 2020. Expectations that the Fed will again step in to help the market with lower interest rates should a recession loom has enabled investors to push prices to all-time highs despite markets trading at historically
dangerous valuation levels.
When market prices progress beyond the limits dictated by fundamental factors established through many decades, it is typically a result of some new issue that convinces investors to ignore normal valuation limits and to accept extreme valuations. Typically, the belief is that “it’s different this time.” Today’s new dynamic is artificial intelligence (AI). In retrospect, however, it is clear that truly transformational factors have, in fact, confirmed the wisdom of honoring longstanding valuation norms. Over time, we’ve seen that the introduction of automobiles, radio, television, air transportation, computers and the internet have all proven to be transformational. As each was introduced, excitement followed, typically accompanied by a boost to equity prices. In each instance, however, no matter how transformational the new phenomenon, markets eventually reverted to historically normal levels of valuation. It is important also to recognize that from overvaluation extremes even far less significant than today’s, normal valuation levels have never before been reached by fundamental conditions improving enough to justify the prior extreme prices. In those instances, the reversion to normal or below normal levels has always occurred by prices declining, not by fundamentals improving. Is AI so different and transformational that it will prevent reversion to historically normal valuations?
In our January Quarterly Commentary (2023 4th Quarter Market Commentary – Mission Management & Trust Co. (missiontrust.com) I outlined the conflict between strong technical conditions and predominantly weak fundamentals. Let me update the progress of market prices and technical and fundamental conditions.
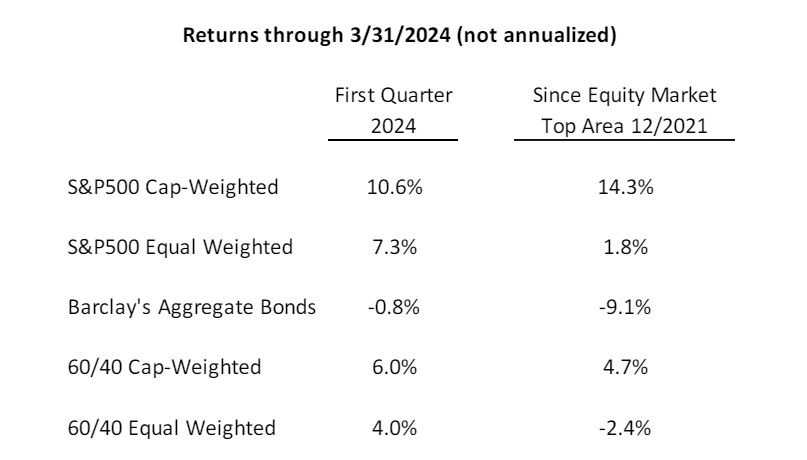
As the following table indicates, this year’s first quarter was strong for stocks and weak for bonds. Despite the strength of the equity market over the past five months, the average S&P500 stock is up by a meager 1.8% since the major equity market indexes peaked just before or after year-end 2021. Bonds, except for very short maturities, have provided a significant negative total return over that 27-month span. Only the capitalization-weighted S&P500 index provided any appreciable return over that two and a quarter year period. Almost all of that return came from the Magnificent 7 megacap technology issues. Mission’s conservative total portfolio approach over that same time period has provided better returns than each of these indexes except the all-equity capitalization-weighted S&P500.
 The strong equity market rally since late-October turned many technical conditions from negative to positive. While the equity weakness in the first two weeks of this quarter has increased the likelihood of a somewhat deeper pullback, a great many stocks are still in intermediate-term uptrends, which usually indicates the probability of further gains after any pullback.
While the majority of technical indicators remain positive, excessive optimism and a pick-up in insider selling show that not all signs are bullish. Overall technical conditions, however, remain net positive.
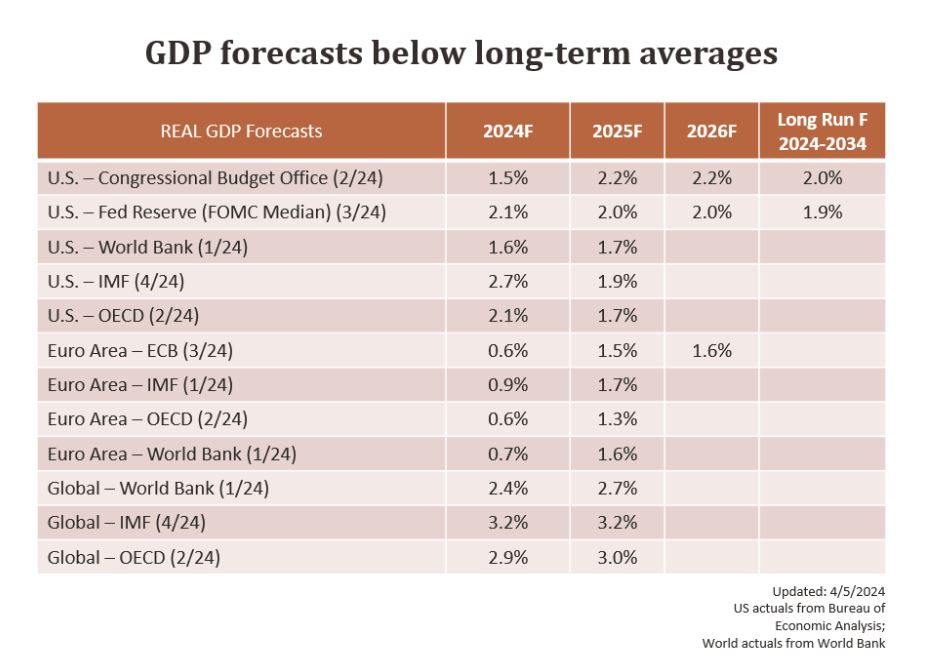
Fundamental conditions are another matter. While stronger GDP in the last half of 2023 brought full-year growth results up to 3.1%, that number is still slightly below the country’s long-term average growth rate. The following table shows the minimal growth expectations that virtually all independent forecasters have for both domestic and global economies for the next few years.
 Despite these weak GDP forecasts, ever-bullish Wall Street forecasts double digit earnings growth for S&P500 companies both this year and next. It will be an impressive feat if earnings come even close to those estimates, unless today’s economic outlooks prove to be far too pessimistic. As we enter first quarter earnings announcement season, the bullish full year earnings forecasts are looking difficult to meet. Forecasts for
this year’s first quarter have been reduced week by week, and FactSet indicates that the first quarter consensus earnings estimate is now down to 0.9%. At the same time, on a Generally Accepted Accounting Principles (GAAP) basis, the S&P500’s price/earnings ratio is 26.6 at April 12 closing prices, among the highest readings ever.
In our January Quarterly Commentary, I spelled out in considerable detail how the U.S. market has performed following major peaks of overvaluation over the past 90 years. At year-end, the S&P500 was more overvalued than the average valuation at the eight prior major market peaks since the late 1930s. It was also more overvalued than at six of the eight prior peaks. With the equity strength in the first quarter, the end of March overvaluation is even greater than at year-end. It is now less overvalued only than that at the March 2000 peak which led to two bear markets and to the March 2009 S&P500 index 57% below its 2000 peak.
There is no way to know if the market is at or near a peak, but it would be foolhardy to ignore what the market has done following even lower levels of overvaluation than today’s. From the prior eight peaks, the average market decline was 40% to its ultimate trough. The declines took prices back to levels first reached on average 9 years earlier. It took an average of 9.8 years to permanently exceed each prior peak of overvaluation.
With investor enthusiasm and confidence in Fed assistance still strong, positive technical conditions could push prices to new record highs. At the same time, even if prices do rise further, it is important to recognize that the modern U.S. market has never before failed to decline significantly from even less overvalued market levels than those resulting from the recent rally.
Could AI prove to be the new phenomenon that overcomes the market’s unblemished record of significant declines from even less overvalued market peaks than what we are experiencing today?
We welcome the opportunity to review with clients how they prefer to have us balance the risk and reward potentials in the current economic and market environment.
Thomas J. Feeney
Chief Investment Officer
Mission’s market and investment commentaries reflect the analysis, interpretation, and economic views and opinions of our investment team. They are not intended to provide investment advice for any individual situation. Please contact us if we can provide insight and advice for your specific needs.

