
February 2026 Market Commentary
Market Update and Economic Developments
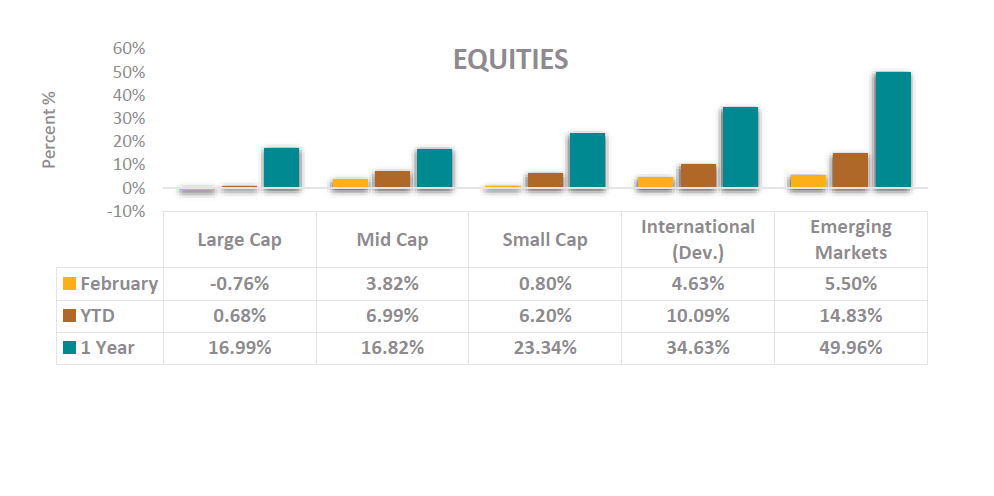
- The S&P 500 posted a modest decline of -0.76% in February, with the index finishing roughly flat year-to-date at 0.68%. Technology and Consumer Discretionary were notable laggards, as investor rotation away from high valuation growth stocks accelerated late in the month amid renewed uncertainty over artificial intelligence and elevated valuations. Despite the soft monthly return, Q4 2025 earnings season concluded on a strong note, with the blended earnings growth rate for the S&P 500 at 13.2% over the past year. Information Technology, Industrials, and Communication Services led earnings growth, while Consumer Discretionary and Energy were the only sectors to report year-over-year earnings declines.
- Tariff policy remained front and center for equity markets in February. Following a Supreme Court ruling that restricted the administration’s use of the International Emergency Economic Powers Act (IEEPA) for tariff imposition, President Trump invoked Section 122 of the Trade Act of 1974, implementing a broad 15% global import surcharge. While subsequently applied at a lower 10% level, the announcement contributed to a spike in market volatility late in the month. As was the case throughout 2025, investors continue to weigh the evolving tariff framework. The interconnectedness of the global economy makes it difficult to draw clean conclusions about ultimate winners and losers from trade policy shifts.
- International stocks had a strong February, posting a return of 4.63% and outperforming the S&P 500 by more than 5 percentage points for the month. This strong month for international stocks brings the relative performance of the MSCI EAFE to the S&P 500 over a one-year period to its widest margin in 20 years. Emerging Markets Equity also had a strong month, adding onto a notably strong year for performance over the last year. Not all of international and emerging markets strength reflects underlying local market performance, as recent depreciation of the dollar relative to foreign currencies gives a boost to U.S. investors in international markets. The most recent notable movement in the dollar relative to foreign currencies occurred in the first six months of 2025, and the dollar has since been more stable. Over the long-term, currency movements tend to be negligible sources of investor returns, while the primary drivers of returns are fundamental earnings growth and dividends.
Fixed Income Market Update & Other Assets
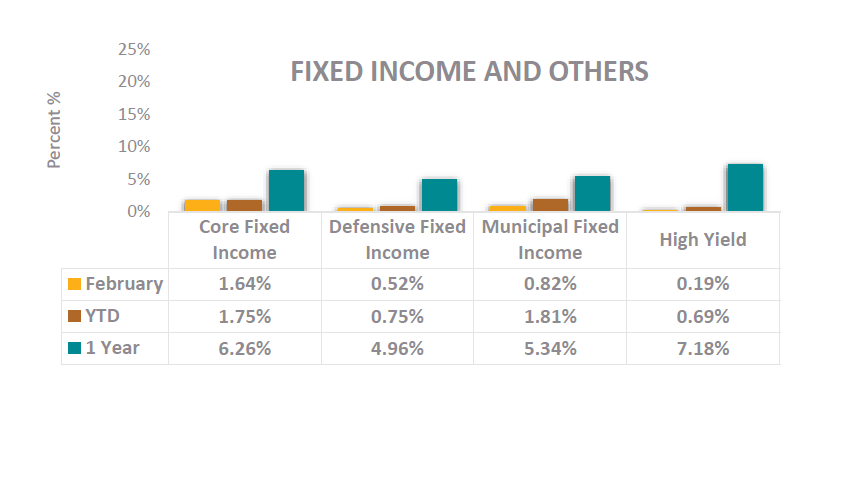
- The yield on the 10-year Treasury declined in February, finishing the month at approximately 3.97% after starting the month near 4.26%. Core fixed income, as measured by the Bloomberg US Aggregate Bond Index, posted a strong return of 1.64% in February, benefiting from the decline in Treasury yields. The rally in bonds provided a welcome ballast to equity portfolios during a period of elevated uncertainty. The move lower in yields was driven by a combination of safe-haven demand from geopolitical uncertainty and growing concerns over the potential impact of escalating tariffs on U.S. economic growth. The Federal Open Market Committee did not hold a scheduled meeting in February, so the federal funds target rate range remained unchanged at 3.50%–3.75%. According to the CME Group FedWatch Tool, markets are assigning approximately 98% probability to no rate change at the Fed’s upcoming March meeting.
- Inflation data in February presented a mixed picture. While the Consumer Price Index showed overall inflation running at approximately 2.4% year-over-year, approaching the Federal Reserve’s 2% target, the Producer Price Index (PPI) came in above expectations for the second consecutive month, raising concerns about potential pipeline price pressures. The coexistence of moderating headline inflation and stickier upstream costs has put the Fed in a challenging position, as it attempts to balance its dual mandate of price stability and maximum employment. The labor market has shown weakness through new job growth that stems primarily from reduced immigration, but the unemployment rate is below both 10- and 20-year averages. The Fed’s preference for robust data to support rate cuts is expected to keep policy steady through at least the first half of 2026.
- Precious metals were among the most talked about assets in the market to start 2026. Gold briefly touched nearly $5,400 per ounce in late January, while silver surged to a new all-time nominal high of around $121 per ounce. The rally was fueled by geopolitical uncertainty, concerns over Federal Reserve independence, and aggressive speculative positioning. The euphoria was short-lived, however, as both metals experienced a historic reversal to start the month, when silver futures crashed 31.4% in a single session, the largest single-day decline since 1980, and gold fell approximately 11%. The selloff was further amplified by margin calls, forced liquidations, and algorithmic selling.
Mission’s market and investment commentaries reflect the analysis, interpretation, and economic views and opinions of our investment team. They are not intended to provide investment advice for any individual situation. Please contact us if we can provide insight and advice for your specific needs.
