2022 1st Quarter Market Commentary
Almost No Place To Hide
There was little opportunity for profit in traditional asset categories in this year’s first quarter. The S&P 500, against which most equity returns are measured, rallied nicely in late-March but finished down for the quarter by 4.6%. The Nasdaq Composite, which includes most of the mega-tech companies that have led the market higher for the past few years, likewise rallied powerfully late in the quarter to cut a more than 20% decline to a 9.1% three-month loss.
The fixed income market, which normally acts as a buffer when equities decline, compounded performance problems in the first quarter. The Barclay’s Capital Aggregate Bond Index, the broadest measure of domestic bond performance, declined by 5.9%, marking the worst quarter in more than 40 years. While we properly anticipated rising rates and kept our fixed income holdings at the short end of the maturity spectrum, they still declined in price, albeit far less than the double-digit losses experienced by long duration bonds.
Money kept in risk-free 90-day U.S. Treasury Bills would have avoided the losses in risk-bearing securities, but they would have earned a negligible 0.08%, or 80 cents for each $1,000 loaned to the government for the quarter.
Gold prices grew by 6.8% in the first three months of the year, so our small hedge in gold added a bit to portfolios where we were authorized to use it. Broader commodity indexes, in which we are not authorized to invest, were the only category to earn an appreciable return, increasing by almost 30%. Unfortunately, almost everyone is beginning to feel the effects of that rise at the gas pump, in the grocery store and wherever we buy the necessities or luxuries of life.
With as many variables as exist in today’s world, all investors are faced with the question of whether the recent pullback is merely an uncomfortable, but brief, interruption of the march higher in equity prices that has marked most of the period since the Financial Crisis or, alternately, the beginning of a more extended period destined to correct many of the excesses that have built up over the past dozen years or so.
Two far-from-ordinary conditions are tugging equity prices in opposite directions. With major U.S. banks on the verge of bankruptcy in the depths of the 2007-09 Financial Crisis, the government began the most monumental bailout ever undertaken. Not only was the stability of the banking system reestablished, our Federal Reserve and the world’s other major central banks dedicated themselves to the support of the developed world’s stock and bond markets. They created massive amounts of liquidity to ward off recessions and to bolster consumer and investor confidence. Much of that newly created money found its way into stocks and bonds. To the extent that the Fed remains resolute about preventing a recession, it is likely that the governors will do all they can to keep stock prices from any meaningful decline. If they can keep investor confidence elevated, stock prices can continue to advance as they have for the better part of the last 13 years, one of the longest stretches in U.S. history without a lengthy decline.

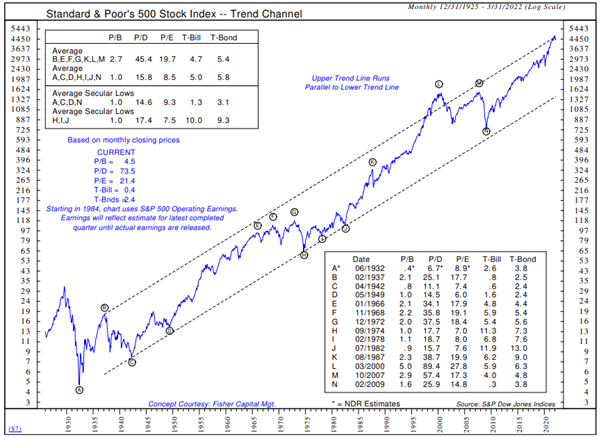
Tugging at stock prices in the opposite direction is the unbroken precedent that, before the current condition, every instance in which valuations stretched well above normal saw stock prices fall significantly, ultimately bottoming well below average levels of valuation. This graph from the outstanding Ned Davis Research firm delineates the S&P 500’s major peaks and troughs since 1932. Those peaks and troughs have been almost universally contained within the upward sloping trend channel. What is most informative is the summary of valuations that have existed at each lettered peak and trough. The table at the lower right shows the price-to-book value, price-to-dividends and price-to-earnings readings for the S&P 500 plus the Treasury Bill and Treasury Bond yields at each designated S&P price extreme.
The table at the upper left shows the average readings of those statistics separately for the peaks and for the troughs. The average stock valuations at the peaks are more than double those at the troughs. Interestingly, there is no appreciable difference in the fixed income yields at major stock market highs compared to yields at market lows. Just below the upper table are the readings for the same measures at the end of this year’s March quarter. The current price-to-book value and price-to-dividend readings are dramatically above the averages of the seven previous major market peaks, and the price-to-earnings reading is marginally above that average of earlier peaks. Because of recent years’ Fed action, the fixed income yields are far below most prior readings at both peaks and troughs. But fixed income levels have not been markedly different at equity market highs compared to levels at major lows.
What may, in fact, be more indicative of equity market danger than the level of interest rates is the direction of those rates. The rapidly rising rates that led to the first quarter’s extremely weak fixed income performance are among history’s most aggressive increases. More than a year ago, in their March 2021 issue of the Elliott Wave Financial Forecast, editors Steven Hochberg and Peter Kendall expressed a prospective concern for stock prices when interest rates should begin to elevate from then current Fed-induced minimal rate levels. At that time they cautioned that “numerous times, periods of falling rates followed by a shift toward rising interest rates have preceded major stock market peaks.” Among the instances enumerated were the two current century stock market declines of 50+% and, in the prior century, the extremely destructive declines that began in 1929 and 1987. In the last few weeks Warren Buffett cautioned on CNN Business that he sees shades of the 1980’s crisis in today’s bond market.
After years of lowering short-term interest rates and holding them near the zero bound, the Fed has been forced to change direction and to begin raising rates to counter inflation that has, as a result of many of the Fed’s own policies, risen to four-decade highs. Clearly, Fed spokespeople are expressing confidence that they can engineer economic and market “soft landings”. History, however, is not on their side. Individually, either raising interest rates or withdrawing stimulus has presented problems for equity markets. Implemented together, as the Fed has pledged to do, the downside pressure on equity prices could be significant absent offsetting positive factors.
Major offsetting positives, however, are few. In my view, the most powerful is longstanding investor confidence that central bankers remain unwilling to let equity prices decline to a level that could precipitate a recession. Many investors are speculating that, when push comes to shove, the Fed will ultimately return to supporting markets, even at the expense of allowing excessive inflation. Of course, high levels of inflation have also historically led to weak economies and markets. Additionally, at least in the short run, the formidable store of liquidity provided by the government to offset the effects of the pandemic may continue to support retail sales.
While corporate earnings remain strong, forecasts for upcoming earnings and economic growth are far below what has characterized earlier post-pandemic quarters. Obviously, the war in Ukraine is a major depressant for the global economy. A chorus of voices has announced concern. The International Monetary Fund sees a severe impact on the global economy as a consequence of the sanctions being applied on Russia and on other countries that offer economic assistance to Russia. U.S. Treasury Secretary Janet Yellen recently forecasted that the war will have an “enormous” global economic impact. It’s highly uncertain how the world will adjust to supply chain and sanction problems. Economist David Rosenberg recently pointed out that energy spikes have preceded almost every recession in the last 80 years and, as a result of the war, we are now experiencing another such spike. Rosenberg further worries about the possibility of global food shortages in light of Russia and Ukraine’s role as major grain exporters. The list of potential negatives clearly exceeds the list of positives, which brings us back to the Fed. Nothing short of nuclear war will affect market results as heavily in the months to come as the decisions to be made and implemented by this august band of central bankers.
Ultimately, investors face the dilemma of whether to remain invested near all-time high levels of equity allocation, the current average position, or to reduce exposure to the asset class that has provided almost all the rewards over the past dozen years. The current equity-heavy position will likely continue to be prudent if the Fed succumbs to market pressure that could result from its intended inflation-fighting strategy. A reversion to the Fed’s post-Financial Crisis market rescue pattern could provide continuing portfolio rewards to those choosing to bet that the Fed will be unwilling to allow meaningful equity market declines. On the flip side, the more conservative approach will prove more prudent if reversion to the mean brings equity prices back down to historically normal levels relative to underlying fundamentals. Given today’s valuation measures, this is a conflict never before waged at such a potentially consequential level.
By Thomas J. Feeney, Managing Director, Chief Investment Officer
Mission’s market and investment commentaries reflect the analysis, interpretation and economic views and opinions of our investment team. They are not intended to provide investment advice for any individual situation. Please contact us if we can provide insight and advice for your specific needs.

